NPO ESCOT:value-creating non-profit organization
Wave-type upwelling pump
Chairman of the Board of Directors of NPO Escot Haruo Fujimoto
ser.kashiwa@gmail.com
Minato Research Foundation Takatoshi
Noguchi noguchi@wave.or.jp
Introduction:
Small wave-powered upwelling devices are being developed as a technology to increase food production in coastal waters.
In response to the destabilization of land agriculture caused by climate change and population growth, the project aims to revitalize marine resources by pumping nutrient-rich bottom water to the sea surface to increase the proliferation of phytoplankton.
keyword:
Artificial upwelling area, wave upwelling pump, vertical mixing, measures against oligotrophy, measures against oxygen deficiency, CO2 capture in ocean (DAC), fishing reef with upwelling function, bottom mud mixing, suppression of methane emission, revitalization of coastal fisheries, ecosystem, environmental awareness
Purpose of the study :
- Energy-free wave pump recirculates accumulated nutrients
- Promoting self-reliance among fisheries workers with equipment that can be manufactured by DIY
- Marine fertility utilizing Japan’s vast ocean area and number of rivers
- Potential for application as a fisheries resource management model in low-latitude regions
This technology aims to create a sustainable food production base by replacing the naturally upwelled ocean areas, which currently account for only 0.1% of the area.
Novelty of this research :
- The vertical mixing effect of the artificial upwelling device that uses wave power will be measured and analyzed in detail, particularly in terms of water temperature changes in 10cm increments at depths of 0.1 to 3m.
- Conducting long-term demonstration tests in experimental waters facing the open ocean, aiming to develop equipment that is both practical and durable
Research topics :
(1) Seawater temperature survey: Data analysis in Onjuku Town, Chiba Prefecture, the center of Ise Bay, and Katsuura City
(2) Ocean fertilization and seabed cultivation
(3) Development and effectiveness of artificial upwelling device
(4) Summary
(1) Seawater temperature survey: Data analysis in Onjuku Town, Chiba Prefecture, the center of Ise Bay, and Katsuura City
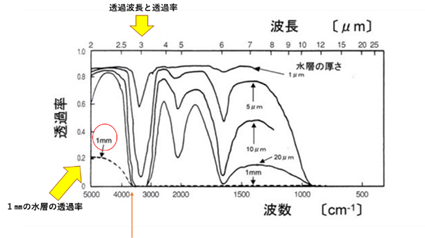
Infrared absorption characteristics of water
It is believed that a thin layer on the ocean surface absorbs most of the far infrared rays due to the light absorption characteristics of water.
Far infrared rays, also known as heat rays, are electromagnetic waves with wavelengths of 4-1000 μm.
As can be seen from the table below, a 1 mm layer of water absorbs almost 100% of far infrared rays with wavelengths of 3 μm or more.
This is thought to be the main cause of the abnormally high temperatures of the ocean surface.
Table 1-1: Water thickness and light transmittance by wavelength = Source: Solar System Promotion Association
1) Water temperature and air temperature data at Iwawada Fishing Port, Onjuku, Chiba Prefecture
We collected seawater temperature data and developed a small artificial upwelling device in an ultra-shallow sea area with a depth of 0.1m to 3m in a section of Iwawada Fishing Port in Onjuku Town, Chiba Prefecture. Onjuku
Town faces the open ocean and is known as a mecca for spiny lobster and alfonsino in the fisheries industry, and for tourism, as a place for swimming in the sea in summer and surfing.
Figure 1-1: Onjuku Town, Chiba Prefecture
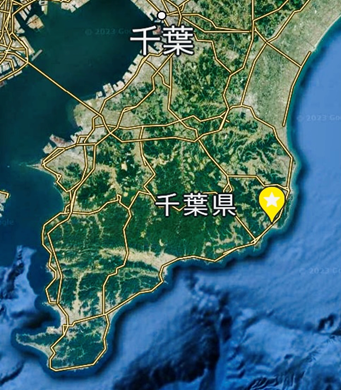
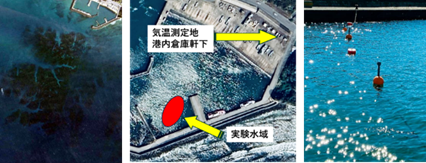
Figure 1-1-2: Iwawada Fishing Port. From the left, Iwawada Fishing Port in Onjuku Town, the test waters and the air temperature measurement location within the port, and the measurement buoy
- Water temperature change at a depth of 0.1m
The air temperature and water temperature at a depth of 0.1 m in July 2024 were roughly linked to solar radiation.
Table 1-1: Atmospheric temperature and temperature at a depth of 0.1 m = 2024.7.1 – 2024.7.31
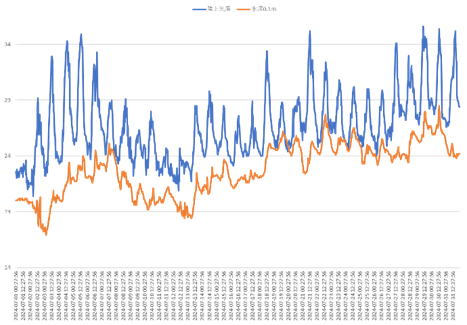
Table 1-1-2: Land temperature: Comparison of water temperature changes at depths of 0.1m, 03m, and 2.0m, July 30, 2024
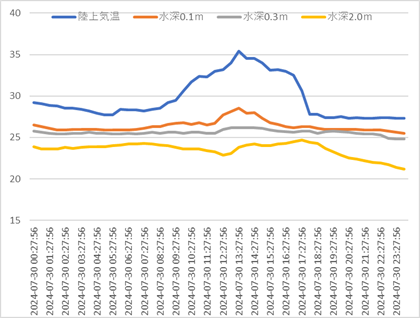
The maximum air temperature rose to nearly 35°C. Accordingly, the water temperature at a depth of 0.1m rose sharply to 28°C between 12:00 and 15:00.
However, no significant changes were observed at depths of 0.3m (gray line) and 2.0m (yellow line).
- Water temperature fluctuations by depth
The average water temperature difference of 2.04℃ between depths of 0.1m and 2.0m is set at 100, and the heat absorption rate by depth is shown.
Table 1-2: Comparison of water temperatures at depths of 0.1m, 0.3m, and 2.0m = 2024.7.1 – 2024.7.31
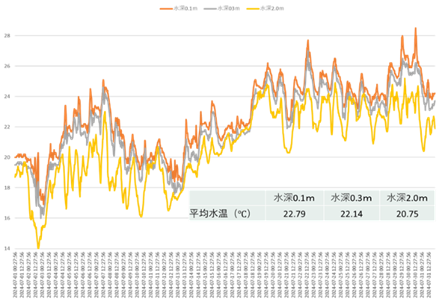
Entire section: Average temperature difference between depths of 0.1m and 2.0m was 2.04℃ = 100
Average temperature difference between depths of 0.1m and 0.3m was 0.65℃, and the absorption rate in this section was 32% of the total.
The solar energy is absorbed by the polar ocean surface due to the light absorption properties of water. It was
also shown that the sea surface temperature remains high day and night (for almost a month) and there is no vertical conversion.
- Comparison of vertical water temperatures in winter
Below is the vertical water temperature change in January and February 2024 (winter).
Table 1-3: January 2024, comparison of water temperature at depths of 0.3m and 2.5m.
The grey vertical bars indicate the vertical water temperature difference = 0.3m water temperature minus 2.5m water temperature.
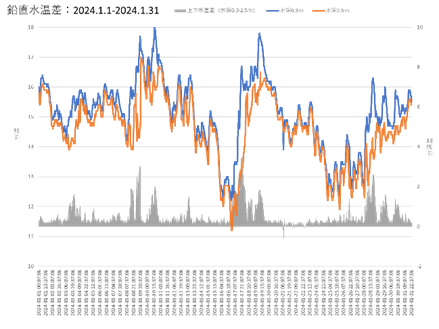
Table 1-4: Comparison of water temperatures at depths of 0.3m and 2.5m in February 2024
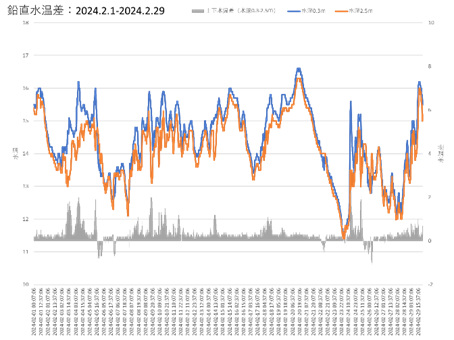
It was inferred that at Iwawada Fishing Port in Onjuku, Chiba Prefecture, the surface sea water temperature was higher than the water temperature below it during the summer months of July and winter months of January and February, suppressing the diversion of water.
2) Central Ise Bay data
*We received central Ise Bay data obtained using an automatic measurement system in August 2024 and conducted analysis in shallow waters.
Figure 1-1-1: Measurement point “Ise Bay central data”
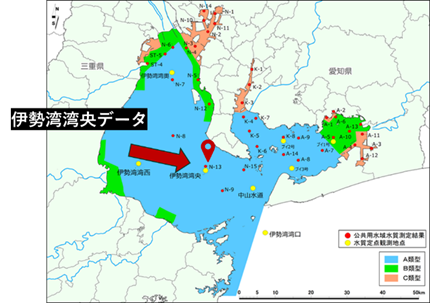
Table 1-5: Water depth at 15:00 on August 1, 2024
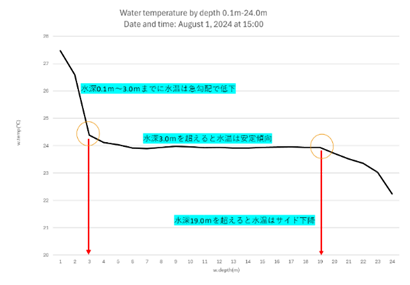
A drop in water temperature of approximately 3°C was observed between depths of 0.1m and 3.0m, after which there was no change up to a depth of 19m, and
then a drop in water temperature of approximately 2°C was observed from 19m to the bottom.
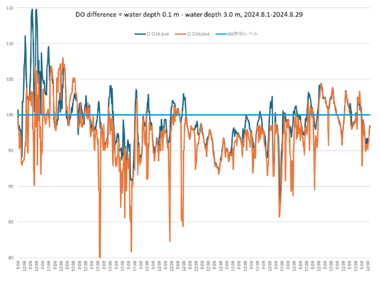
The changes in sea water temperature and water temperature difference at the central observation point in Ise Bay for the month of August are shown hourly.
Table 1-6: Depth of 0.1m: Water temperature at depth of 3.0m and temperature difference between above and below, 2024.08.01-08.29, Interval = 1 hour
* Depth of 0.1m (orange) and depth of 3.0m (blue) The green vertical bar indicates the vertical water temperature difference = 0.1m-3.0m water temperature
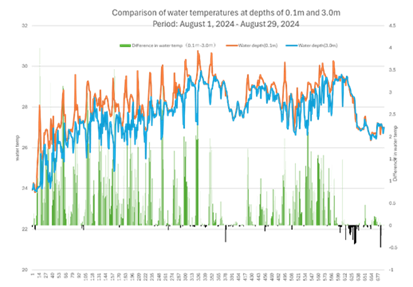
Figure 1-2: Routes of Typhoon No. 7 and Typhoon No. 10
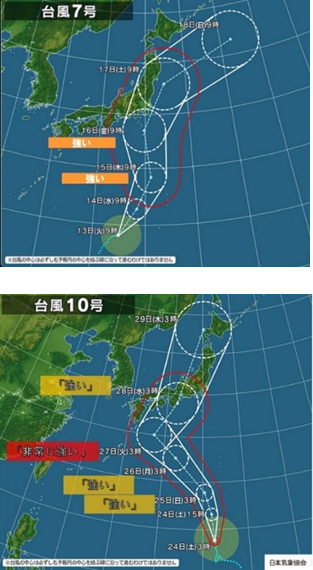
*From the Japan Weather Association website
At almost all times, the water temperature at a depth of 0.1m was higher than that at a depth of 3.0m.
The temperature difference between the water temperature at a depth of 0.1m and that at a depth of 3.0m was a maximum of 4°C, with an average of 0.6°C
. Additionally, a drop in sea surface temperature and a reduction in the vertical water temperature difference were observed in mid-August and in the latter half of August . This is presumably due to the vertical mixing of seawater caused by Typhoons No. 7 and No. 10,
which passed over the eastern ocean . From the above, it appears that in Ise Bay as well, the sea surface temperature was higher than the water temperature below during the summer months of August, and no diversion occurred.
Incidentally, analysis of winter water temperatures in the center of Ise Bay was not possible because there was no detailed data available for the depth range of 0.1m to 3.0m.
- Vertical change in DO value, data from central Ise Bay
Rising sea surface temperatures are a factor that reduces the amount of dissolved oxygen and carbon dioxide.
Table 1-8: Changes in water temperature with respect to oxygen and dissolved CO2 = Source: Hokkaido University LASBOS, Japan Institute of Marine Engineering
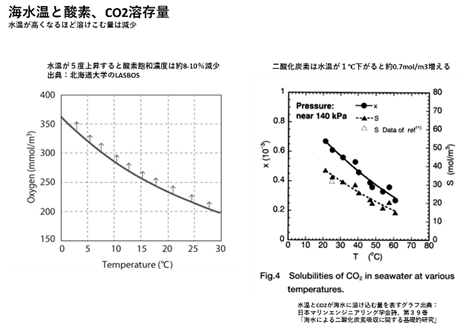
Table 1-9: Comparison of DO values at the center of Ise Bay at depths of 0.1m and 3.0m, August 2024
*Blue bars indicate a DO value of 100
*There was a large difference in DO values between depths of 0.1m and 3.0m.
Table 1-10: Daily changes in dissolved oxygen levels, August 1, 2024
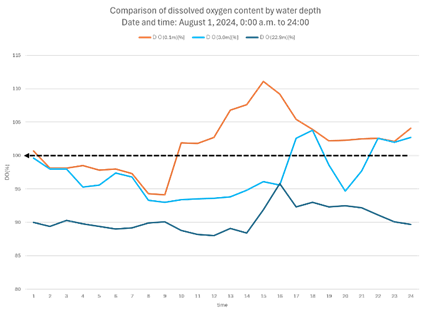
*The DO value at 0.1m was supersaturated after 9:00 a.m.
3) Sea surface temperature (skin) data at a depth of 8.0 m and 60 m off the coast of Ubara, Katsuura City
, Chiba Prefecture. This compares the water temperature at a depth of 8 m directly below the Katsuura Underwater Observation Tower, located approximately 60 m offshore, from April 1, 2022 to March 31, 2023 with the Japan Meteorological Agency’s daily sea surface temperature data (sea surface temperature from the Himawari geostationary meteorological satellite).
Table 1-7: Sea surface temperature data from the Japan Meteorological Agency and water temperature data at a depth of 8m directly below the underwater observation tower
*Data provided by: Chiba Prefecture Katsuura Underwater Park Center General Incorporated Foundation
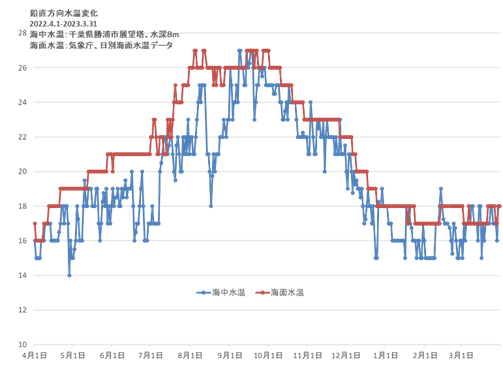
As a result , the sea surface temperature was higher than the water temperature at a depth of 8 m on approximately 95% of the measurement days throughout the year. The maximum difference in water temperature
during this period was 8°C.
- Water temperature data analysis results
1: The condition of surface sea water temperature being higher than submarine water temperature had become the norm.
2: The rise in water temperature due to solar radiation was particularly noticeable near the surface sea water during the day, but the impact at a depth of about 2m was small.
3: It was confirmed that in summer (daytime), the water temperature at a depth of 2-3m was 2-3°C lower than the sea surface.
4: Vertical mixing due to the passage of the typhoon was confirmed, and the effect of vertical mixing was evident.
5: The DO value was supersaturated near the surface of the ocean during the day, and it was inferred that stirring had an effect of preventing oxygen deficiency.
(2) Ocean fertilization and seabed cultivation
One of the measures to deal with nutrient deficiencies in marine areas is seabed cultivation,
in which a rake-like device is sunk to the seabed and pulled by a fishing boat to directly cultivate the seabed.
1) The effects of seabed cultivation:
Seabed cultivation stirs up the mud on the seabed, stirs up diatom seeds, and supplies oxygen to the seabed.
Trials are being carried out in Tomonoura, Hiroshima Prefecture, Osaka Bay, and other areas to suppress the occurrence of plankton that causes red tides and shellfish poisoning.
Figure 2-1: A fishing boat cultivating the seabed (bottom left) and a seabed cultivating tool (bottom right)
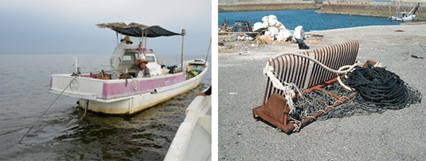
Figure 2-2: Activation of diatom dormant cells
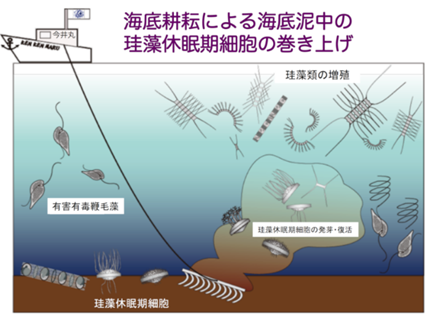
Source: Environmental Conservation Research Association website
Figure 2-3: Expected effects of seabed cultivation
*Improvement of primary productivity by supplying nutrients to the water
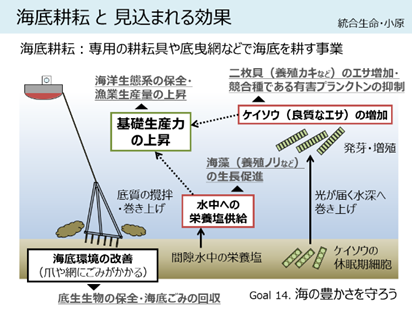
Source: Graduate School of Integrated Life Sciences, Hiroshima University
Below are the conclusions of a paper by Ohara Shizuka, specially appointed assistant professor at the Graduate School of Integrated Life Sciences, Hiroshima University, regarding the effectiveness of seabed cultivation in the inner part of Kojima Bay.
“Tilling increased nutrient concentrations in the ocean, with DIN and NH4-N concentrations in the bottom layer increasing by about 4.3 and 3.8 µM, respectively.
Within an hour after cultivation was completed, the concentrations decreased and flowed out of the cultivation area.
It was also thought that the increase in nutrient concentrations in the ocean was mostly due to nutrients in the interstitial water of the stirred-up mud.
Tilling stirred up the surface layer of the bottom mud, exposing the anaerobic lower layer. It was found that this had the effect of supplying oxygen to the stirred-up and exposed mud, and it is expected that this will promote the decomposition of organic matter.”
2) Benefits and challenges of seabed cultivation
1: It has the effect of promoting the recirculation of nutrients that have settled in the lower layers.
2: It is expected to have a direct economic support effect on those involved in the fishing industry.
3: There is room for improvement in terms of energy consumption (=CO2 emissions) in operating fishing boats.
4: Since the work is done near the seabed, no upwelling effect is expected.
(3) Development and effects of wave-powered artificial upwelling device
- Development History
The 2019 Boso Typhoon prompted me to start developing the pump from scratch.
I knew intuitively through my hobby of surfing that there is a water layer at shallow depths that is several degrees lower than the sea surface. It
was also well known locally that female divers can be put into dangerous situations due to sudden changes in water temperature.
Therefore, I intuitively felt that the sea surface temperature could be lowered by pumping up low-temperature water several meters below the surface.
The pumping method I came up with was a wave-type upwelling pump, in which a PVC pipe with a check valve is hung from a buoy and submerged in water, and the up and down movement of the waves is used to pump up the lower layer water.
This was an application of the old well-digging technique called Kazusabori in Chiba.
Kazusabori is an excavation technique in which an iron pipe with a check valve is inserted into a hole filled with water and moved up and down, pumping up the soil along with the muddy water.
The only difference is that the elastic force of the bamboo is used to pull the iron pipe up, while the wave-type upwelling pump uses wave power.
I later learned that Vershinsky was the first to develop the artificial upwelling device, a device that uses wave power to pump deep seawater, in 1983.
- Precedent cases
A paper from Griffith University, Gold Coast, Australia, states the following about upwelling:
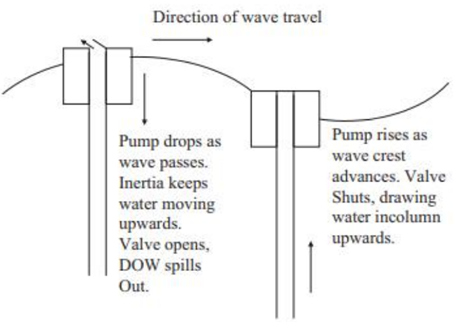
“It consists of a vertical tube with a float at the top, equipped with a check valve, and uses the up and down movement of the waves to pump the deep ocean water (DOW) inside the tube to the surface.
It has been demonstrated that, in a swell with a wave height of 0.35m, a tube with a cross-sectional area of 0.071 square meters (diameter 0.3m) can pump 10 liters per second from a depth of 30m in a 4-second cycle.”
The advantages of check valve type upwelling pumps are
1: Simple design allows for compact size.
2: No energy supply is required as it only uses wave power.
Efficiency needs to be improved on a practical scale, and the wave energy conversion efficiency is set at about 6% of the incident wave energy.
It is expected to be usable for the following purposes:
1: Supplying nutrient-rich deep water to the surface, strengthening the marine ecosystem and fishery resources.
2: Reducing the impact of typhoons and cyclones (by cooling the sea surface temperature).
Figure 3-1: Illustration of a wave upwelling pump = Source: Griffith University, Gold Coast
Regarding the development of artificial upwelling pumps using wave power, there has been no new experimental information since large-scale testing off the coast of Hawaii conducted by the University of Hawaii and the University of Oregon.
- Japan’s first check valve type wave upwelling pump
Since 2019, NPO Escot has been working with Shibaura Institute of Technology, the Department of Mechanical Engineering, and the former Tanaka Kotaro Laboratory to develop a wave upwelling pump with a check valve that pumps low-level seawater using only the up and down movement of waves.
1: The upwelling principle of the wave upwelling pump
2: About the structure, function and damage of the wave upwelling pump
3: About the upwelling effect and upwelling amount of the wave upwelling pump
4: The potential of the wave upwelling pump
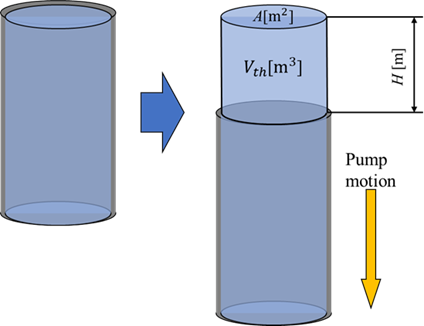
- Principle of upwelling of wave upwelling pump
The upwelling pump suspended in the ocean repeatedly rises and falls due to the up and down movement of a round buoy floating on the sea surface.
① When rising, the upper valve closes, sealing off the top of the upwelling tube and rising together with the water inside.
② When descending, the upper valve opens due to the inertia of the water and the upward water pressure from the bottom of the upwelling tube, allowing the water to be discharged.
Figure 3-1-2: Principle of upwelling, Source: Shibaura Institute of Technology
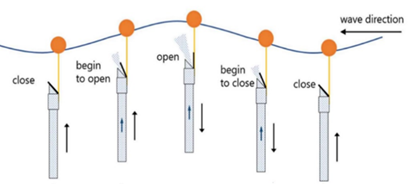
Figure 3-2: Upwelling visualization experiment using kelp, Source: Shibaura Institute of Technology
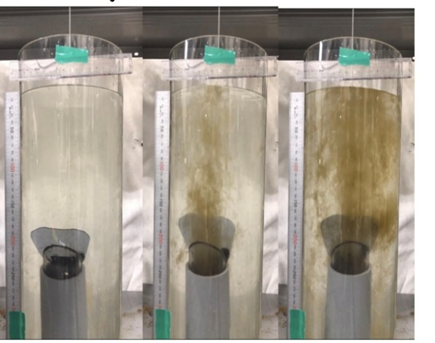
Figure 3-3: Image of underwater upwelling. Left: valve closed during upwelling. Right: valve open during downwelling. *These are photos edited from a video.
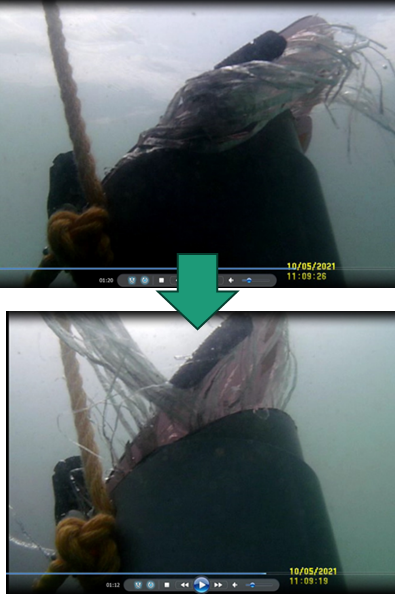
*The valve opens and drains water as the windsock descends.
*When the waves are small, the valve body opens and closes less, and the number of times it opens and closes increases.
- Structure, function and damage of wave upwelling pump
It consists of the following three parts.
① Floating body (buoy) section: Floats on the sea surface and captures the energy of wind and waves.
② Upwelling pipe section with check valve: Suspended from the floating body in the sea and pumps up low-lying water.
③ Other: Upwelling pipe cleaning, seabed cultivation functions
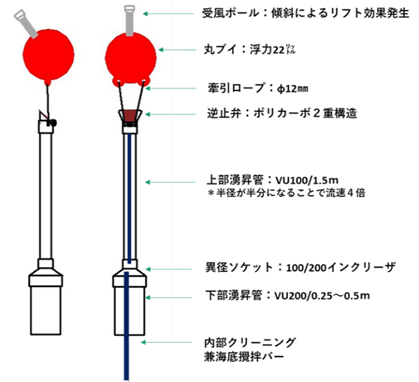
Figure 3-4: Illustration of the entire upwelling pump
① Floating body (buoy) part = Floats on the sea surface and captures the energy of waves and wind.
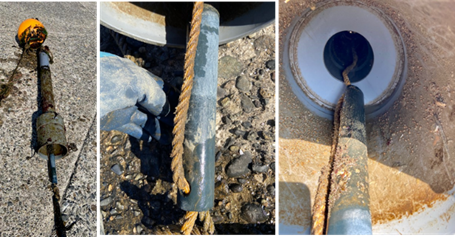
a: Ropework around the buoy and upwelling tube
1: Two independent ropes were used to tow the upwelling tube and to secure the buoy, preventing it from being washed away.
2: To prevent wear on the buoy, the rope in question was covered with a hose.
3: Two towing ropes were installed, one on each side of the check valve, to prevent energy loss due to the rotation and precession of the upwelling tube.
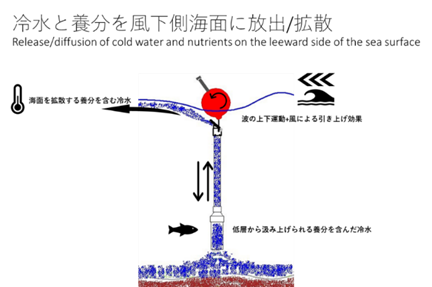
4: When connecting the buoy to the fixed part (anchor or main rope), the discharge direction from the check valve was kept downwind.
Figure 3-5: Rope connection method around a buoy
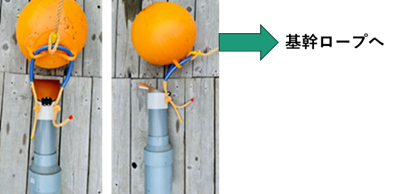
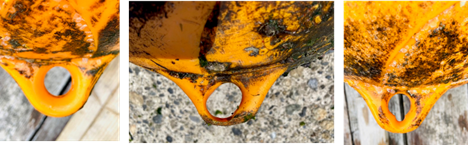
Figure 3-5-1: Worn buoy hole. The photo on the left shows a normal buoy hole.
b: Wind-receiving pole on the buoy
A wind-receiving pole was attached to the top of the buoy at an angle of about 45 degrees to the horizontal.
Figure 3-6: Wind-receiving pole
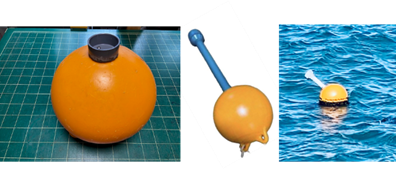
* Fix the PVC pipe cap with silicone and screws and attach the wind receiving pole.
Effect of installing a wind receiving pole
1: The pendulum motion of the buoy lifts the upwelling tube.
2: The wind-receiving pole falls to the downwind side, keeping the water discharged from the valve body on the downwind side.
Figure 3-7: Effect of lifting due to toppling of buoy

* Raising height (h) = buoy radius (r) – buoy radius (r) x cosθ
Figure 3-8: Buoy falling downwind
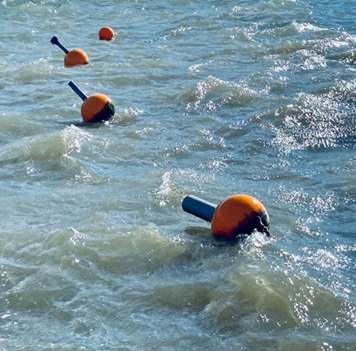
* A buoy with a wind-receiving pole that tilts downwind
Figure 3-9: Illustration showing the downwind diffusion of upwelled water
② Upwelling pipe section with check valve
a: check valve
1: The center of the valve body has a double reinforced structure of 2mm x 2 polycarbonate plates.
2: To reduce water pressure during rising, the valve body is installed at an angle (30° to the horizontal).
3: A heavy hinge with a thick axis that can withstand opening and closing 20,000 to 40,000 times per day is used.
4: A tire is used as the closing force elastic body to reduce valve body opening and closing failure due to irregular waves.
5: The bolts and nuts used to secure the valve body are made of rust-resistant SUS314.
Figure 3-10: Check valve image
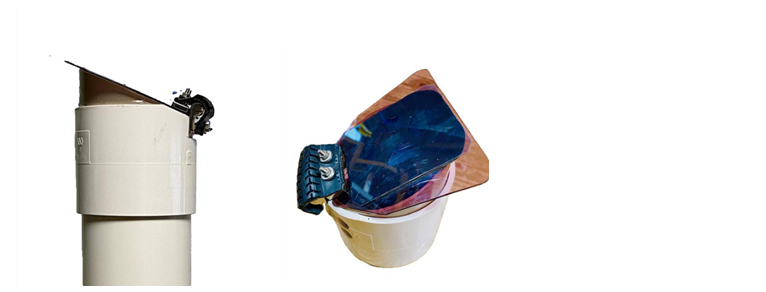
*Based on PVC pipe joint VU100, it has been made more versatile for wider use.
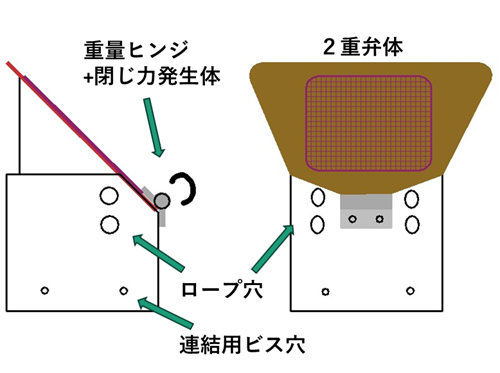
Figure 3-11: Check valve structure and names of each part
b: Upwelling
pipe The upwelling pipe is made of PVC pipe, which is used as a drainage pipe part, due to its versatility, workability, and economical efficiency.
The upwelling pipe is connected to the top of the pipe using a VU100 + differential joint VU100/200 + VU200 connection method.
Figure 2-11: Connection structure of upwelling pipes
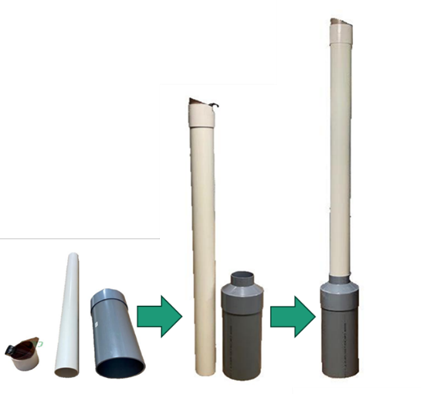
Features: Effect of different diameter pipes
i. Highly responsive to small and irregular waves that are typical of inland seas = reliable upwelling even with 5 cm wavesii
. Overall weight reduction = reduced workload, reduced buoy sinking loss, shorter vibration periodiii
. Increased flow speed inside the pipe when discharging = wider diffusion area on the sea surfaceiv
. Miniaturized check valve = measures to prevent damage to valve body and metal fittings used, reduced water pressure resistance when rising
c: Others = cleaning of upwelling tubes, mixing of the seafloor
A cleaning bar made of a VP25 PVC pipe and a 10 mm rope was suspended inside the upwelling tube to prevent biological growth and to add a seabed stirring function.
Figure 2-12: Internal cleaning and subsea stirring bar
* The ropes on the sides of the bar sweep the inner surface of the upwelling pipe to suppress biological adhesion.
Features and Effects:
i. Prevention of biological adhesion = Maintenance of upwelling amount
ii. Seabed cultivation effect = Recirculation of nutrients deposited on the seabed
iii. Vertical support of upwelling pipe = Prevention of tilt of upwelling pipe due to tidal current
Figure 2-13: Photographs of biological attachment.
Upper left: barnacles, upper right: seaweed and sand deposits, two intermediate images: wakame seaweed attachment, lower left: mussels (outside the tube), lower right: oysters attachment (inside the tube).
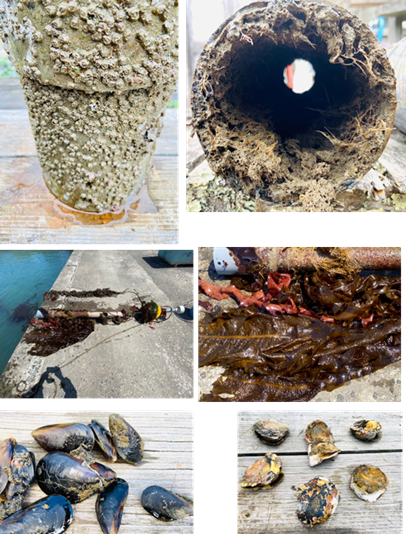
*Bioadherence reduces the flow rate and increases the weight, resulting in a decrease in the number of vibrations.
③ 流失、破損
A: The cause and countermeasures
i. Buoy + upwelling pump main unit set lost once, cause was rope work strength
⇒ know-how acquired based on the experience of fishery workers (Satsuma tying, etc.)
ii. Upwelling pump main unit lost once, cause was rope wear and break
⇒ spare rope introduced
iii. Temperature measurement buoy + logger case lost, one case unknown (occurred during commissioned measurement in Ishinomaki Sameura Bay)
⇒ guidance given to contractor
iv. Logger case lost seven times, cause was insufficient fixing strength and repeated collisions with the seabed
⇒ installation location changed
v. Logger case leaked water five times, cause was dirty gasket and repeated contact with the seabed
⇒ double waterproofing inside the logger case, contact information written inside the case
b: Possible causes and countermeasures for upwelling pump damage
i. Valve body damaged multiple times, due to insufficient strength ⇒ double structure adopted
ii. Bolt rust, deformation ⇒ changed to SUS316
iii. Hinge wear, about 0.1mm per year, within the allowable range
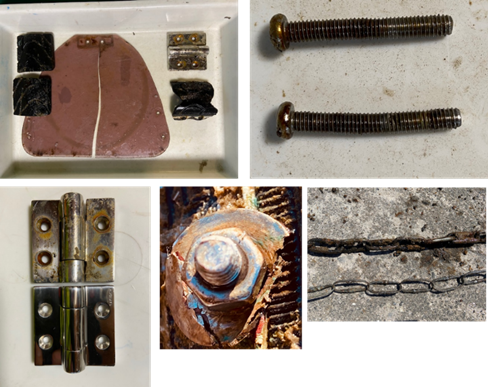
iv. Washer crack, custom-made washer used for t1.5mm
v. Chain for cleaning inside the upwelling pipe thinned, changed to bar + rope system
Figure 2-14: Damaged parts images = Upper left: valve body cracked, upper right: bolt rust, deformation, lower left: hinge wear 0.1mm/year, lower center: washer cracked, lower right: chain thinning
- Upwelling effect and upwelling amount
We attempted to verify upwelling efficiency by comparing the vertical water temperature difference with and without an upwelling pump.
① Verification test
Test water surface: Iwawada Fishing Port, Onjuku-machi, Chiba Prefecture
Equipment type: VU125 upwelling pipe, total length 2m
Verification method: PVC pipes with and without upwelling function (both 2m long) were laid 3m apart and the water temperature changes at depths of 0.2m and 2.0m were compared (measurement interval 15 minutes)
Figure 3-1: Test implementation diagram
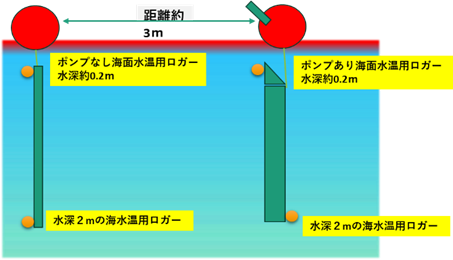
Figure 3-1-1: Temperature logger installation status
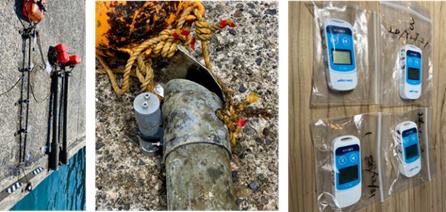
Table 3-1: Results of a one-week vertical water temperature comparison test with and without an upwelling pump = 2023.9.11 to 2023.9.18
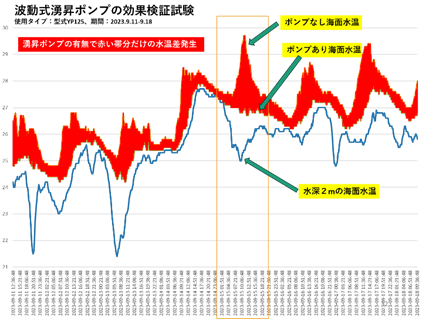
*The red band indicates the cooling layer of sea surface water temperature due to the upwelling pump effect
Table 3-2: Comparison test results of vertical water temperature on one day with and without upwelling pump = September 15, 2023
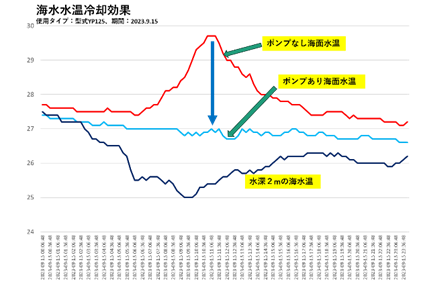
*The upwelling pump reduces the vertical water temperature difference by about half
Table 3-2-1: Vertical water temperature change without upwelling pump, depth 0.3 m: depth 2.0 m = 2024.9.16 – 2024.11.29
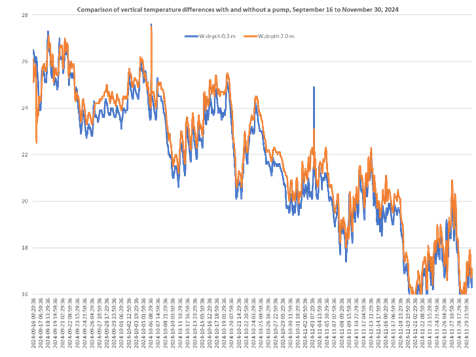
*Average water temperature difference = 0.47℃
Table 3-2-2: Vertical water temperature change with improved upwelling pump (VU100/200), water depth 0.3 m: water depth 2.0 m = 2024.9.16 – 2024.11.29
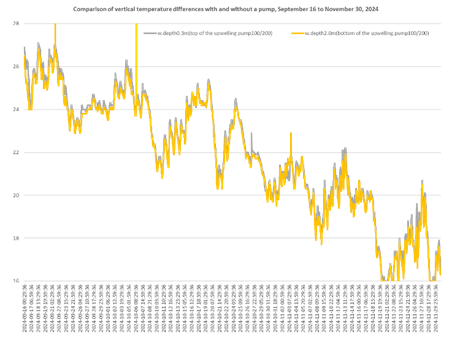
*Average water temperature difference = 0.21℃
By pumping seawater from a depth of 2.0 m to a depth of 0.3 m, the average water temperature difference was reduced by 46%.
② 湧昇量計算
As there was no compact integrating flow meter that could be stored inside the upwelling tube, a calculation formula from Griffith University, Gold Coast, Australia was used to calculate the upwelling volume.
Table 3-3: Calculation formula for Griffith University Gold Coast Campus
*A is the area of the tube, H is the wave height from trough to crest, and T is the wave period.
Assume that the maximum rising speed of the pump is equal to the maximum rising speed of the water surface.
Theoretical formula for upwelling:
Q_th=πAH/T (-∆ρ/ρ gAT)
(A: pipe cross-sectional area, H: amplitude, T: wave period)
(ρ: water density, ∆ρ: density difference, g: gravitational acceleration)
It is assumed that upwelling occurs from a shallow layer, so losses due to differences in specific gravity of seawater are ignored.
表3-4:湧昇量試算、上部管径100㎜+下部管径200㎜
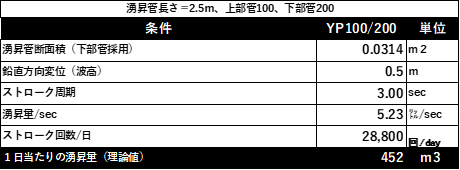
* Wave height 50cm, approx. 450 tons/day with a 3-second cycle
③ Estimation of the sea surface diffusion area of upwelled water
The wave height and period are the same as in Table 3-4.
The intermediate values of the reference literature and the Chiba Prefecture annual average wind speed (underlined values) were used for the estimation of the surface current speed. The specific gravity difference caused by the difference in water temperature was ignored because it is minor, unlike the pumping of deep seawater.
Table 3-5: Estimated sea surface diffusion area of upwelled water
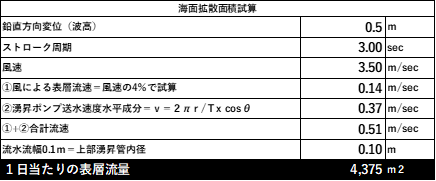
*The diffusion area (water layer thickness = 0.1m) is estimated to be approximately 4,370m2/day
*References for surface current calculations
a: References: Regarding surface currents caused by wind, the following published response to an inquiry to the Japan Meteorological Agency by Kondo Junsei, Department of Geophysics, Faculty of Science, Tohoku University, was used.
“The flow speed of wind-driven currents (surface currents caused by wind) near the sea surface is generally considered to be around 3-5% of the wind speed.”
b: The following information was used for the average annual wind speed along the coast of Chiba Prefecture.
“The average annual wind speed along the coast of Chiba Prefecture varies depending on the region, but it is generally considered to be in the range of 3-4m/s in many places.”
(4) Summary
1. Vertical water temperature trends were measured in 10 cm increments, and data was collected and analyzed particularly in the depth range of 0.1 to 3 m.
2. In developing the upwelling device, we were able to develop a practical and durable device by utilizing an experimental water area facing the open ocean.
Conclusion on water temperature measurement
1. It was confirmed that the seawater temperature at a depth of 0.1 to 0.3 m rises significantly during the day due to the influence of solar radiation.
It is believed that the warm water lid that spreads over the ocean surface increases the amount of water vapor produced, inhibiting the absorption of oxygen and CO2 into the ocean.
2. In summer, at a depth of 2-3m, there exists a seawater layer that is 2-3°C cooler than at a depth of 0.1-0.3m.
Vertical mixing in shallow waters is expected to suppress the rise in sea surface temperatures while also having the effect of re-diffusing nutrients in the lower layers.
We believe that this fact indicates an alternative to pumping deep ocean water using gigantic upwelling devices that are difficult to manage.
3. The water temperature at a depth of 0.1 to 0.3 m was greater than the water temperature at a depth of 2 to 3 m, and this continued almost all day and all year round.
The continued poor nutrition and hypoxia are thought to be the cause of coastal barrenness and poor fishing practices.
Conclusions in the development of wave upwelling pumps.
This is a summary of the wave upwelling device and its effects.
- Zero Energy:
i. No external energy source is required as it only uses wave power
ii. No secondary pollution is generated - Multipurpose use:
i. Typhoon/heavy rain control by cooling sea surface temperature from summer to autumn
ii. Prevention of death of fish and shellfish from lack of oxygen by improving DO value in low layers through promotion of water circulation
iii. Increase in fish catch by increasing marine plankton
iv. Fishing reef effect (outside of upwelling pipe) - Versatility and standardization:
i. Except for the check valve, the drain pipe (VU100 and VU200) is used, ensuring the versatility of parts.
ii. Fisheries related parties can manufacture, use, sell and dispose of them themselves. - Environmental considerations:
i. Cleaning bars prevent the growth of ecosystems (seaweed, shellfish, etc.) inside the upwelling tube. - Adaptability:
i. Size can be adjusted according to the characteristics of the sea area where it is installed
ii. Small size and light weight make it easy to install, remove and dispose
iii. Ocean fertilization in collaboration with marine fertilizer
iv. Can be improved to suit target fish species such as seaweed, clams and oysters
v. Utilization of existing buoys and existing floating bodies (ships, navigation buoys, etc.)
vi. Increase in upwelling water volume when swells arrive immediately after a typhoon occurs = automatic adjustment of pumping volume
Future Effects:
i. Suppression of water vapor generation by cooling sea surface temperature = Control of the enlargement of typhoons, hurricanes, and cyclones
ii. Revitalization of fishery resources by creating coastal upwelling areas = artificial upwelling areas
iii. Marine fertilization by re-dispersing nutrients deposited in estuaries = Measures against oligotrophy
iv. Physical increase in CO2 capture by cooling sea surface temperature = DAC function
v. Improvement of sustainability of fisheries = SDGs
Related ongoing research:
i. Verifying iron recovery and redistribution using magnetic sheets and the ability to prevent biological adhesion
ii. Verifying a method to prevent biological adhesion on the outside of the upwelling pipe using a main rope
Acknowledgements:
We would like to express our deep gratitude to Hideo Hatanaka, president of the Onjuku Iwawada Fisheries Cooperative Association, for kindly agreeing to provide us with the experimental waters and equipment storage facility necessary for carrying out this research. President Hatanaka provided us with advice based on his knowledge of the marine field, which is based on his long experience as a fisherman in the open sea. We would
also like to thank the Onjuku Town Hall for granting us permission to use the sea area.
We would also like to thank former Professor Kotaro Tanaka of the Shibaura Institute of Technology and his students for providing us with ideas and equipment from a university perspective.
References:
1) Brian Kirke: Enhancing fish stocks with wave-powered artificial upwelling, Ocean & Coastal Management
Volume 46, Issues 9–10, 2003, Pages 901-915
2) Mayu Takahashi: Development of an evaluation method for the pumping volume and vertical displacement of a wave-driven upwelling pump, Shibaura Institute of Technology, Faculty of Engineering Graduation Thesis, P9, P37, 2021.
Possibility of wave-type upwelling pump in cooling sea surface temperature and redispersion of sinking nutrients in shallow waters (estuaries and inland seas)
Chairman of the Board of Directors of NPO Escot Haruo Fujimoto ser.kashiwa@gmail.com
Minato Research Foundation Takatoshi
Noguchi noguchi@wave.or.jp
IntroductionFood production on land is expected to become unstable due to meteorological risks such as drought, high temperatures, heavy rain, and forest fires. On the other hand
, research into new food production technology fields is essential to respond to the global population increase.
This research is related to revitalizing marine resources in coastal waters and suppressing the rise in sea surface temperature.
Specifically, it is the development of a wave-type upwelling device that uses only the power of waves to pump low-layer nutrients and low-temperature water to near the sea surface.
Approximately half of the world’s fish catches are produced in upwelling areas, where nutrient-rich low-level water rises to the sea surface, and the area of these areas is said to be only 0.1% of the entire ocean.
In this research, we use a wave upwelling pump to pump nitrogen, phosphorus, and other nutrients that accumulate in the estuary to near the sea surface, and increase phytoplankton through photosynthesis.
Specifically, we install many of these pumps, which do not require any resource or energy input, around the estuary, and use wave power to promote the recirculation of accumulated nutrients.
The upwelling device will be small, lightweight, and have a structure that allows for DIY manufacturing, so that installation, maintenance, and disposal can be carried out by fishery workers themselves.
In Japan, which has the sixth largest ocean area in the world and is home to many rivers, increasing marine food production in coastal areas is considered a rational approach.
Ocean fertilization through artificial upwelling is recognized worldwide as a means of revitalizing fishery resources.
Keywords: artificial upwelling area, wave upwelling pump, vertical mixing, sea surface water temperature cooling, nutrient recirculation, measures against oligotrophy, measures against oxygen deficiency, CO2 capture in ocean (DAC), photosynthesis activation, fish reef with upwelling function, bottom mud mixing, methane emission suppression, coastal fishery revitalization, ecosystem, environmental awareness
Research objectives and novelty: The
purpose of this study is to verify the effectiveness of wave-type artificial upwelling in revitalizing fishery resources and cooling sea surface temperatures in coastal areas around Japan.
The following two points are novel aspects of this research.
1. We measured and analyzed the annual change in vertical water temperature in 10 cm increments.
This revealed that there is a low-temperature water layer 2 to 3 meters deep that is 2 to 3 degrees Celsius lower than the ocean surface.
* Detailed data analysis at this depth has never been conducted before.
2. Through long-term use of experimental waters facing the open ocean, we developed a device closer to practical use.
Through long-term continuous testing, we gained a lot of knowledge about material selection, connection methods, and measures against biological adhesion.
3. We were able to gather a wide variety of knowledge, including material selection, improvements to connection methods, and measures to prevent biological adhesion.
Research topics
: (1) Seawater temperature survey: Data analysis in Onjuku Town, Chiba Prefecture, the center of Ise Bay, and Katsuura City;
(2) Ocean fertilization and seafloor cultivation
; (3) Development and effectiveness of artificial upwelling devices
; (4) Summary
(1) Seawater temperature survey: Data analysis in Onjuku Town, Chiba Prefecture, the center of Ise Bay, and Katsuura City
Infrared absorption characteristics of water
It is believed that a thin layer on the ocean surface absorbs most of the far infrared rays due to the light absorption characteristics of water.
Far infrared rays, also known as heat rays, are electromagnetic waves with wavelengths of 4-1000 μm.
As can be seen from the table below, a 1 mm layer of water absorbs almost 100% of far infrared rays with wavelengths of 3 μm or more.
This is thought to be the main cause of the abnormally high temperatures of the ocean surface.
Table 1-1: Water thickness and light transmittance by wavelength = Source: Solar System Promotion Association
1) Water temperature and air temperature data at Iwawada Fishing Port, Onjuku, Chiba Prefecture
We collected seawater temperature data and developed a small artificial upwelling device in an ultra-shallow sea area with a depth of 0.1m to 3m in a section of Iwawada Fishing Port in Onjuku Town, Chiba Prefecture. Onjuku
Town faces the open ocean and is known as a mecca for spiny lobster and alfonsino in the fisheries industry, and for tourism, as a place for swimming in the sea in summer and surfing.
Figure 1-1: Onjuku Town, Chiba Prefecture
Figure 1-1-2: Iwawada Fishing Port. From the left, Iwawada Fishing Port in Onjuku Town, the test waters and the air temperature measurement location within the port, and the measurement buoy
- Water temperature change at a depth of 0.1m
The air temperature and water temperature at a depth of 0.1 m in July 2024 were roughly linked to solar radiation.
Table 1-1: Atmospheric temperature and temperature at a depth of 0.1 m = 2024.7.1 – 2024.7.31
Table 1-1-2: Land temperature: Comparison of water temperature changes at depths of 0.1m, 03m, and 2.0m, July 30, 2024
The maximum air temperature rose to nearly 35°C. Accordingly, the water temperature at a depth of 0.1m rose sharply to 28°C between 12:00 and 15:00.
However, no significant changes were observed at depths of 0.3m (gray line) and 2.0m (yellow line).
- Water temperature fluctuations by depth
The average water temperature difference of 2.04℃ between depths of 0.1m and 2.0m is set at 100, and the heat absorption rate by depth is shown.
Table 1-2: Comparison of water temperatures at depths of 0.1m, 0.3m, and 2.0m = 2024.7.1 – 2024.7.31
Entire section: Average temperature difference between depths of 0.1m and 2.0m was 2.04℃ = 100
Average temperature difference between depths of 0.1m and 0.3m was 0.65℃, and the absorption rate in this section was 32% of the total.
The solar energy is absorbed by the polar ocean surface due to the light absorption properties of water. It was
also shown that the sea surface temperature remains high day and night (for almost a month) and there is no vertical conversion.
- Comparison of vertical water temperatures in winter
Below is the vertical water temperature change in January and February 2024 (winter).
Table 1-3: January 2024, comparison of water temperature at depths of 0.3m and 2.5m.
The grey vertical bars indicate the vertical water temperature difference = 0.3m water temperature minus 2.5m water temperature.
Table 1-4: Comparison of water temperatures at depths of 0.3m and 2.5m in February 2024
It was inferred that at Iwawada Fishing Port in Onjuku, Chiba Prefecture, the surface sea water temperature was higher than the water temperature below it during the summer months of July and winter months of January and February, suppressing the diversion of water.
2) Central Ise Bay data
*We received central Ise Bay data obtained using an automatic measurement system in August 2024 and conducted analysis in shallow waters.
Figure 1-1-1: Measurement point “Ise Bay central data”
Table 1-5: Water depth at 15:00 on August 1, 2024
A drop in water temperature of approximately 3°C was observed between depths of 0.1m and 3.0m, after which there was no change up to a depth of 19m, and
then a drop in water temperature of approximately 2°C was observed from 19m to the bottom.
The changes in sea water temperature and water temperature difference at the central observation point in Ise Bay for the month of August are shown hourly.
Table 1-6: Depth of 0.1m: Water temperature at depth of 3.0m and temperature difference between above and below, 2024.08.01-08.29, Interval = 1 hour
* Depth of 0.1m (orange) and depth of 3.0m (blue) The green vertical bar indicates the vertical water temperature difference = 0.1m-3.0m water temperature
Figure 1-2: Routes of Typhoon No. 7 and Typhoon No. 10
*From the Japan Weather Association website
At almost all times, the water temperature at a depth of 0.1m was higher than that at a depth of 3.0m.
The temperature difference between the water temperature at a depth of 0.1m and that at a depth of 3.0m was a maximum of 4°C, with an average of 0.6°C
. Additionally, a drop in sea surface temperature and a reduction in the vertical water temperature difference were observed in mid-August and in the latter half of August . This is presumably due to the vertical mixing of seawater caused by Typhoons No. 7 and No. 10,
which passed over the eastern ocean . From the above, it appears that in Ise Bay as well, the sea surface temperature was higher than the water temperature below during the summer months of August, and no diversion occurred.
Incidentally, analysis of winter water temperatures in the center of Ise Bay was not possible because there was no detailed data available for the depth range of 0.1m to 3.0m.
- Vertical change in DO value, data from central Ise Bay
Rising sea surface temperatures are a factor that reduces the amount of dissolved oxygen and carbon dioxide.
Table 1-8: Changes in water temperature with respect to oxygen and dissolved CO2 = Source: Hokkaido University LASBOS, Japan Institute of Marine Engineering
Table 1-9: Comparison of DO values at the center of Ise Bay at depths of 0.1m and 3.0m, August 2024
*Blue bars indicate a DO value of 100
*There was a large difference in DO values between depths of 0.1m and 3.0m.
Table 1-10: Daily changes in dissolved oxygen levels, August 1, 2024
*The DO value at 0.1m was supersaturated after 9:00 a.m.
3) Sea surface temperature (skin) data at a depth of 8.0 m and 60 m off the coast of Ubara, Katsuura City
, Chiba Prefecture. This compares the water temperature at a depth of 8 m directly below the Katsuura Underwater Observation Tower, located approximately 60 m offshore, from April 1, 2022 to March 31, 2023 with the Japan Meteorological Agency’s daily sea surface temperature data (sea surface temperature from the Himawari geostationary meteorological satellite).
Table 1-7: Sea surface temperature data from the Japan Meteorological Agency and water temperature data at a depth of 8m directly below the underwater observation tower
*Data provided by: Chiba Prefecture Katsuura Underwater Park Center General Incorporated Foundation
As a result , the sea surface temperature was higher than the water temperature at a depth of 8 m on approximately 95% of the measurement days throughout the year. The maximum difference in water temperature
during this period was 8°C.
- Water temperature data analysis results
1: The condition of surface sea water temperature being higher than submarine water temperature had become the norm.
2: The rise in water temperature due to solar radiation was particularly noticeable near the surface sea water during the day, but the impact at a depth of about 2m was small.
3: It was confirmed that in summer (daytime), the water temperature at a depth of 2-3m was 2-3°C lower than the sea surface.
4: Vertical mixing due to the passage of the typhoon was confirmed, and the effect of vertical mixing was evident.
5: The DO value was supersaturated near the surface of the ocean during the day, and it was inferred that stirring had an effect of preventing oxygen deficiency.
(2) Ocean fertilization and seabed cultivation
One of the measures to deal with nutrient deficiencies in marine areas is seabed cultivation,
in which a rake-like device is sunk to the seabed and pulled by a fishing boat to directly cultivate the seabed.
1) The effects of seabed cultivation:
Seabed cultivation stirs up the mud on the seabed, stirs up diatom seeds, and supplies oxygen to the seabed.
Trials are being carried out in Tomonoura, Hiroshima Prefecture, Osaka Bay, and other areas to suppress the occurrence of plankton that causes red tides and shellfish poisoning.
Figure 2-1: A fishing boat cultivating the seabed (bottom left) and a seabed cultivating tool (bottom right)
Figure 2-2: Activation of diatom dormant cells
Source: Environmental Conservation Research Association website
Figure 2-3: Expected effects of seabed cultivation
*Improvement of primary productivity by supplying nutrients to the water
Source: Graduate School of Integrated Life Sciences, Hiroshima University
Below are the conclusions of a paper by Ohara Shizuka, specially appointed assistant professor at the Graduate School of Integrated Life Sciences, Hiroshima University, regarding the effectiveness of seabed cultivation in the inner part of Kojima Bay.
“Tilling increased nutrient concentrations in the ocean, with DIN and NH4-N concentrations in the bottom layer increasing by about 4.3 and 3.8 µM, respectively.
Within an hour after cultivation was completed, the concentrations decreased and flowed out of the cultivation area.
It was also thought that the increase in nutrient concentrations in the ocean was mostly due to nutrients in the interstitial water of the stirred-up mud.
Tilling stirred up the surface layer of the bottom mud, exposing the anaerobic lower layer. It was found that this had the effect of supplying oxygen to the stirred-up and exposed mud, and it is expected that this will promote the decomposition of organic matter.”
2) Benefits and challenges of seabed cultivation
1: It has the effect of promoting the recirculation of nutrients that have settled in the lower layers.
2: It is expected to have a direct economic support effect on those involved in the fishing industry.
3: There is room for improvement in terms of energy consumption (=CO2 emissions) in operating fishing boats.
4: Since the work is done near the seabed, no upwelling effect is expected.
(3) Development and effects of wave-powered artificial upwelling device
- Development History
The 2019 Boso Typhoon prompted me to start developing the pump from scratch.
I knew intuitively through my hobby of surfing that there is a water layer at shallow depths that is several degrees lower than the sea surface. It
was also well known locally that female divers can be put into dangerous situations due to sudden changes in water temperature.
Therefore, I intuitively felt that the sea surface temperature could be lowered by pumping up low-temperature water several meters below the surface.
The pumping method I came up with was a wave-type upwelling pump, in which a PVC pipe with a check valve is hung from a buoy and submerged in water, and the up and down movement of the waves is used to pump up the lower layer water.
This was an application of the old well-digging technique called Kazusabori in Chiba.
Kazusabori is an excavation technique in which an iron pipe with a check valve is inserted into a hole filled with water and moved up and down, pumping up the soil along with the muddy water.
The only difference is that the elastic force of the bamboo is used to pull the iron pipe up, while the wave-type upwelling pump uses wave power.
I later learned that Vershinsky was the first to develop the artificial upwelling device, a device that uses wave power to pump deep seawater, in 1983.
- Precedent cases
A paper from Griffith University, Gold Coast, Australia, states the following about upwelling:
“It consists of a vertical tube with a float at the top, equipped with a check valve, and uses the up and down movement of the waves to pump the deep ocean water (DOW) inside the tube to the surface.
It has been demonstrated that, in a swell with a wave height of 0.35m, a tube with a cross-sectional area of 0.071 square meters (diameter 0.3m) can pump 10 liters per second from a depth of 30m in a 4-second cycle.”
The advantages of check valve type upwelling pumps are
1: Simple design allows for compact size.
2: No energy supply is required as it only uses wave power.
Efficiency needs to be improved on a practical scale, and the wave energy conversion efficiency is set at about 6% of the incident wave energy.
It is expected to be usable for the following purposes:
1: Supplying nutrient-rich deep water to the surface, strengthening the marine ecosystem and fishery resources.
2: Reducing the impact of typhoons and cyclones (by cooling the sea surface temperature).
Figure 3-1: Illustration of a wave upwelling pump = Source: Griffith University, Gold Coast
Regarding the development of artificial upwelling pumps using wave power, there has been no new experimental information since large-scale testing off the coast of Hawaii conducted by the University of Hawaii and the University of Oregon.
- Japan’s first check valve type wave upwelling pump
Since 2019, NPO Escot has been working with Shibaura Institute of Technology, the Department of Mechanical Engineering, and the former Tanaka Kotaro Laboratory to develop a wave upwelling pump with a check valve that pumps low-level seawater using only the up and down movement of waves.
1: The upwelling principle of the wave upwelling pump
2: About the structure, function and damage of the wave upwelling pump
3: About the upwelling effect and upwelling amount of the wave upwelling pump
4: The potential of the wave upwelling pump
- Principle of upwelling of wave upwelling pump
The upwelling pump suspended in the ocean repeatedly rises and falls due to the up and down movement of a round buoy floating on the sea surface.
① When rising, the upper valve closes, sealing off the top of the upwelling tube and rising together with the water inside.
② When descending, the upper valve opens due to the inertia of the water and the upward water pressure from the bottom of the upwelling tube, allowing the water to be discharged.
Figure 3-1-2: Principle of upwelling, Source: Shibaura Institute of Technology
Figure 3-2: Upwelling visualization experiment using kelp, Source: Shibaura Institute of Technology
Figure 3-3: Image of underwater upwelling. Left: valve closed during upwelling. Right: valve open during downwelling. *These are photos edited from a video.
*The valve opens and drains water as the windsock descends.
*When the waves are small, the valve body opens and closes less, and the number of times it opens and closes increases.
- Structure, function and damage of wave upwelling pump
It consists of the following three parts.
① Floating body (buoy) section: Floats on the sea surface and captures the energy of wind and waves.
② Upwelling pipe section with check valve: Suspended from the floating body in the sea and pumps up low-lying water.
③ Other: Upwelling pipe cleaning, seabed cultivation functions
Figure 3-4: Illustration of the entire upwelling pump
① Floating body (buoy) part = Floats on the sea surface and captures the energy of waves and wind.
a: Ropework around the buoy and upwelling tube
1: Two independent ropes were used to tow the upwelling tube and to secure the buoy, preventing it from being washed away.
2: To prevent wear on the buoy, the rope in question was covered with a hose.
3: Two towing ropes were installed, one on each side of the check valve, to prevent energy loss due to the rotation and precession of the upwelling tube.
4: When connecting the buoy to the fixed part (anchor or main rope), the discharge direction from the check valve was kept downwind.
Figure 3-5: Rope connection method around a buoy
Figure 3-5-1: Worn buoy hole. The photo on the left shows a normal buoy hole.
b: Wind-receiving pole on the buoy
A wind-receiving pole was attached to the top of the buoy at an angle of about 45 degrees to the horizontal.
Figure 3-6: Wind-receiving pole
* Fix the PVC pipe cap with silicone and screws and attach the wind receiving pole.
Effect of installing a wind receiving pole
1: The pendulum motion of the buoy lifts the upwelling tube.
2: The wind-receiving pole falls to the downwind side, keeping the water discharged from the valve body on the downwind side.
Figure 3-7: Effect of lifting due to toppling of buoy
* Raising height (h) = buoy radius (r) – buoy radius (r) x cosθ
Figure 3-8: Buoy falling downwind
* A buoy with a wind-receiving pole that tilts downwind
Figure 3-9: Illustration showing the downwind diffusion of upwelled water
② Upwelling pipe section with check valve
a: check valve
1: The center of the valve body has a double reinforced structure of 2mm x 2 polycarbonate plates.
2: To reduce water pressure during rising, the valve body is installed at an angle (30° to the horizontal).
3: A heavy hinge with a thick axis that can withstand opening and closing 20,000 to 40,000 times per day is used.
4: A tire is used as the closing force elastic body to reduce valve body opening and closing failure due to irregular waves.
5: The bolts and nuts used to secure the valve body are made of rust-resistant SUS314.
Figure 3-10: Check valve image
*Based on PVC pipe joint VU100, it has been made more versatile for wider use.
Figure 3-11: Check valve structure and names of each part
b: Upwelling
pipe The upwelling pipe is made of PVC pipe, which is used as a drainage pipe part, due to its versatility, workability, and economical efficiency.
The upwelling pipe is connected to the top of the pipe using a VU100 + differential joint VU100/200 + VU200 connection method.
Figure 2-11: Connection structure of upwelling pipes
Features: Effect of different diameter pipes
i. Highly responsive to small and irregular waves that are typical of inland seas = reliable upwelling even with 5 cm wavesii
. Overall weight reduction = reduced workload, reduced buoy sinking loss, shorter vibration periodiii
. Increased flow speed inside the pipe when discharging = wider diffusion area on the sea surfaceiv
. Miniaturized check valve = measures to prevent damage to valve body and metal fittings used, reduced water pressure resistance when rising
c: Others = cleaning of upwelling tubes, mixing of the seafloor
A cleaning bar made of a VP25 PVC pipe and a 10 mm rope was suspended inside the upwelling tube to prevent biological growth and to add a seabed stirring function.
Figure 2-12: Internal cleaning and subsea stirring bar
* The ropes on the sides of the bar sweep the inner surface of the upwelling pipe to suppress biological adhesion.
Features and Effects:
i. Prevention of biological adhesion = Maintenance of upwelling amount
ii. Seabed cultivation effect = Recirculation of nutrients deposited on the seabed
iii. Vertical support of upwelling pipe = Prevention of tilt of upwelling pipe due to tidal current
Figure 2-13: Photographs of biological attachment.
Upper left: barnacles, upper right: seaweed and sand deposits, two intermediate images: wakame seaweed attachment, lower left: mussels (outside the tube), lower right: oysters attachment (inside the tube).
*Bioadherence reduces the flow rate and increases the weight, resulting in a decrease in the number of vibrations.
③ 流失、破損
A: The cause and countermeasures
i. Buoy + upwelling pump main unit set lost once, cause was rope work strength
⇒ know-how acquired based on the experience of fishery workers (Satsuma tying, etc.)
ii. Upwelling pump main unit lost once, cause was rope wear and break
⇒ spare rope introduced
iii. Temperature measurement buoy + logger case lost, one case unknown (occurred during commissioned measurement in Ishinomaki Sameura Bay)
⇒ guidance given to contractor
iv. Logger case lost seven times, cause was insufficient fixing strength and repeated collisions with the seabed
⇒ installation location changed
v. Logger case leaked water five times, cause was dirty gasket and repeated contact with the seabed
⇒ double waterproofing inside the logger case, contact information written inside the case
b: Possible causes and countermeasures for upwelling pump damage
i. Valve body damaged multiple times, due to insufficient strength ⇒ double structure adopted
ii. Bolt rust, deformation ⇒ changed to SUS316
iii. Hinge wear, about 0.1mm per year, within the allowable range
iv. Washer crack, custom-made washer used for t1.5mm
v. Chain for cleaning inside the upwelling pipe thinned, changed to bar + rope system
Figure 2-14: Damaged parts images = Upper left: valve body cracked, upper right: bolt rust, deformation, lower left: hinge wear 0.1mm/year, lower center: washer cracked, lower right: chain thinning
- Upwelling effect and upwelling amount
We attempted to verify upwelling efficiency by comparing the vertical water temperature difference with and without an upwelling pump.
① Verification test
Test water surface: Iwawada Fishing Port, Onjuku-machi, Chiba Prefecture
Equipment type: VU125 upwelling pipe, total length 2m
Verification method: PVC pipes with and without upwelling function (both 2m long) were laid 3m apart and the water temperature changes at depths of 0.2m and 2.0m were compared (measurement interval 15 minutes)
Figure 3-1: Test implementation diagram
Figure 3-1-1: Temperature logger installation status
Table 3-1: Results of a one-week vertical water temperature comparison test with and without an upwelling pump = 2023.9.11 to 2023.9.18
*The red band indicates the cooling layer of sea surface water temperature due to the upwelling pump effect
Table 3-2: Comparison test results of vertical water temperature on one day with and without upwelling pump = September 15, 2023
*The upwelling pump reduces the vertical water temperature difference by about half
Table 3-2-1: Vertical water temperature change without upwelling pump, depth 0.3 m: depth 2.0 m = 2024.9.16 – 2024.11.29
*Average water temperature difference = 0.47℃
Table 3-2-2: Vertical water temperature change with improved upwelling pump (VU100/200), water depth 0.3 m: water depth 2.0 m = 2024.9.16 – 2024.11.29
*Average water temperature difference = 0.21℃
By pumping seawater from a depth of 2.0 m to a depth of 0.3 m, the average water temperature difference was reduced by 46%.
② 湧昇量計算
As there was no compact integrating flow meter that could be stored inside the upwelling tube, a calculation formula from Griffith University, Gold Coast, Australia was used to calculate the upwelling volume.
Table 3-3: Calculation formula for Griffith University Gold Coast Campus
*A is the area of the tube, H is the wave height from trough to crest, and T is the wave period.
Assume that the maximum rising speed of the pump is equal to the maximum rising speed of the water surface.
Theoretical formula for upwelling:
Q_th=πAH/T (-∆ρ/ρ gAT)
(A: pipe cross-sectional area, H: amplitude, T: wave period)
(ρ: water density, ∆ρ: density difference, g: gravitational acceleration)
It is assumed that upwelling occurs from a shallow layer, so losses due to differences in specific gravity of seawater are ignored.
表3-4:湧昇量試算、上部管径100㎜+下部管径200㎜
* Wave height 50cm, approx. 450 tons/day with a 3-second cycle
③ Estimation of the sea surface diffusion area of upwelled water
The wave height and period are the same as in Table 3-4.
The intermediate values of the reference literature and the Chiba Prefecture annual average wind speed (underlined values) were used for the estimation of the surface current speed. The specific gravity difference caused by the difference in water temperature was ignored because it is minor, unlike the pumping of deep seawater.
Table 3-5: Estimated sea surface diffusion area of upwelled water
*The diffusion area (water layer thickness = 0.1m) is estimated to be approximately 4,370m2/day
*References for surface current calculations
a: References: Regarding surface currents caused by wind, the following published response to an inquiry to the Japan Meteorological Agency by Kondo Junsei, Department of Geophysics, Faculty of Science, Tohoku University, was used.
“The flow speed of wind-driven currents (surface currents caused by wind) near the sea surface is generally considered to be around 3-5% of the wind speed.”
b: The following information was used for the average annual wind speed along the coast of Chiba Prefecture.
“The average annual wind speed along the coast of Chiba Prefecture varies depending on the region, but it is generally considered to be in the range of 3-4m/s in many places.”
(4) Summary
1. Vertical water temperature trends were measured in 10 cm increments, and data was collected and analyzed particularly in the depth range of 0.1 to 3 m.
2. In developing the upwelling device, we were able to develop a practical and durable device by utilizing an experimental water area facing the open ocean.
Conclusion on water temperature measurement
1. It was confirmed that the seawater temperature at a depth of 0.1 to 0.3 m rises significantly during the day due to the influence of solar radiation.
It is believed that the warm water lid that spreads over the ocean surface increases the amount of water vapor produced, inhibiting the absorption of oxygen and CO2 into the ocean.
2. In summer, at a depth of 2-3m, there exists a seawater layer that is 2-3°C cooler than at a depth of 0.1-0.3m.
Vertical mixing in shallow waters is expected to suppress the rise in sea surface temperatures while also having the effect of re-diffusing nutrients in the lower layers.
We believe that this fact indicates an alternative to pumping deep ocean water using gigantic upwelling devices that are difficult to manage.
3. The water temperature at a depth of 0.1 to 0.3 m was greater than the water temperature at a depth of 2 to 3 m, and this continued almost all day and all year round.
The continued poor nutrition and hypoxia are thought to be the cause of coastal barrenness and poor fishing practices.
Conclusions in the development of wave upwelling pumps.
This is a summary of the wave upwelling device and its effects.
- Zero Energy:
i. No external energy source is required as it only uses wave power
ii. No secondary pollution is generated - Multipurpose use:
i. Typhoon/heavy rain control by cooling sea surface temperature from summer to autumn
ii. Prevention of death of fish and shellfish from lack of oxygen by improving DO value in low layers through promotion of water circulation
iii. Increase in fish catch by increasing marine plankton
iv. Fishing reef effect (outside of upwelling pipe) - Versatility and standardization:
i. Except for the check valve, the drain pipe (VU100 and VU200) is used, ensuring the versatility of parts.
ii. Fisheries related parties can manufacture, use, sell and dispose of them themselves. - Environmental considerations:
i. Cleaning bars prevent the growth of ecosystems (seaweed, shellfish, etc.) inside the upwelling tube. - Adaptability:
i. Size can be adjusted according to the characteristics of the sea area where it is installed
ii. Small size and light weight make it easy to install, remove and dispose
iii. Ocean fertilization in collaboration with marine fertilizer
iv. Can be improved to suit target fish species such as seaweed, clams and oysters
v. Utilization of existing buoys and existing floating bodies (ships, navigation buoys, etc.)
vi. Increase in upwelling water volume when swells arrive immediately after a typhoon occurs = automatic adjustment of pumping volume
Future Effects:
i. Suppression of water vapor generation by cooling sea surface temperature = Control of the enlargement of typhoons, hurricanes, and cyclones
ii. Revitalization of fishery resources by creating coastal upwelling areas = artificial upwelling areas
iii. Marine fertilization by re-dispersing nutrients deposited in estuaries = Measures against oligotrophy
iv. Physical increase in CO2 capture by cooling sea surface temperature = DAC function
v. Improvement of sustainability of fisheries = SDGs
Related ongoing research:
i. Verifying iron recovery and redistribution using magnetic sheets and the ability to prevent biological adhesion
ii. Verifying a method to prevent biological adhesion on the outside of the upwelling pipe using a main rope
Acknowledgements:
We would like to express our deep gratitude to Hideo Hatanaka, president of the Onjuku Iwawada Fisheries Cooperative Association, for kindly agreeing to provide us with the experimental waters and equipment storage facility necessary for carrying out this research. President Hatanaka provided us with advice based on his knowledge of the marine field, which is based on his long experience as a fisherman in the open sea. We would
also like to thank the Onjuku Town Hall for granting us permission to use the sea area.
We would also like to thank former Professor Kotaro Tanaka of the Shibaura Institute of Technology and his students for providing us with ideas and equipment from a university perspective.
References:
1) Brian Kirke: Enhancing fish stocks with wave-powered artificial upwelling, Ocean & Coastal Management
Volume 46, Issues 9–10, 2003, Pages 901-915
2) Mayu Takahashi: Development of an evaluation method for the pumping volume and vertical displacement of a wave-powered upwelling pump, Shibaura Institute of Technology, Faculty of Engineering, Graduation Thesis, P9, P37,
2021. 3) Report of Okayama Fisheries Research Institute 38, 1-7, 2023
Effect of seabed cultivation on nutrient supply and bottom sediment improvement in Kojima Bay
, Genki Inui, Hidezo Takagi, Yasuji Yamashita, and Shin Komura